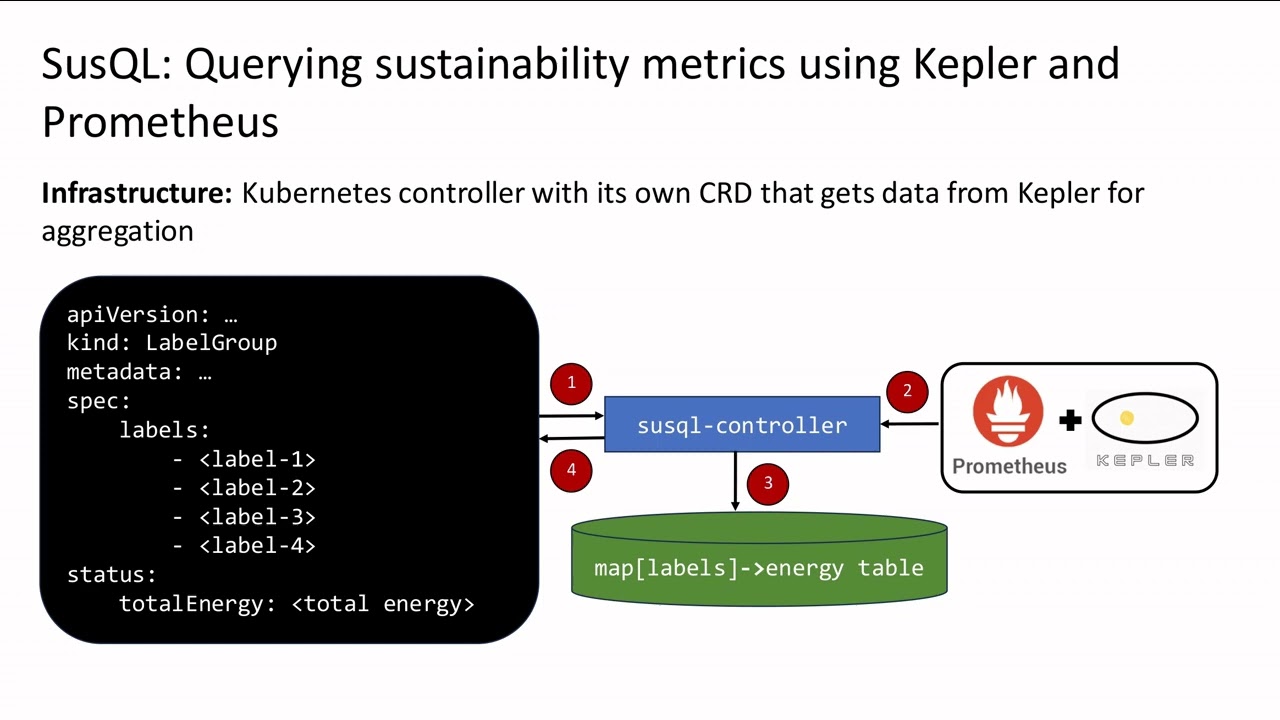
SusQL is a Kubernetes operator that aggregates energy data from pods tagged with SusQL specifi labels. The energy measurements are taken from Kepler which should be installed/deployed in the cluster before using SusQL. Watch a video with a demonstration by clicking on the image bellow.
SusQL is an operator that can be deployed in a Kubernetes/OpenShift cluster. You can use kind or minikube to get a local cluster for testing, or run against a remote cluster.
NOTE: Your controller will automatically use the current context in your kubeconfig file (i.e. whatever cluster kubectl cluster-info shows).
Kepler is assumed to be installed in the cluster.
To install SusQL go to the deployment directory and run the command $ bash deploy.sh. This script does a few actions:
-
Check if Kepler is installed and exposing metrics through prometheus
-
In general, Kepler metrics are exposed, clusterwide, at:
http://<PROMETHEUS_SERVICE>.<PROMETHEUS_NAMESPACE>.svc.cluster.local:9090The deployment script assumes
PROMETHEUS_SERVICE=prometheus-k8sandPROMETHEUS_NAMESPACE=monitoring. If this is not the case, use the deployment script as:$ PROMETHEUS_SERVICE=<prometheus-service> PROMETHEUS_NAMESPACE=<prometheus-namespace> bash deploy.sh
-
-
Create the namespace
susql -
Install the SusQL operator in the namespace
susql- This installation also deploys the CRD and sets the cluster permissions
-
Install a separate Prometheus instance in the namespace
susql
NOTE: This set of actions can be controlled by calling $ bash deploy.sh susql-deploy, for example, if only the SusQL deployment is needed. Check the script for all possible options or run it with the default set of actions.
To begin using SusQL, a LabelGroup is used to specify the set of labels that the controller uses to identify pods that belong to the same energy aggregation. An example of a LabelGroup could be:
apiVersion: susql.ibm.com/v1
kind: LabelGroup
metadata:
    name: labelgroup-name
    namespace: default
spec:
    labels:
        - my-label-1
        - my-label-2
A pod that would be part of the group of pods belonging to the same energy aggregation would specify the LabelGroup labels as:
apiVersion: v1
kind: Pod
metadata:
    name: pod-name
    labels:
        susql.label/1: my-label-1
        susql.label/2: my-label-2
spec:
    containers:
        - name: container
          image: ubuntu
          command: ["sleep"]
          args: ["infinity"]
Energy of the group of pods is exposed in 2 ways:
- Through Prometheus at
http://prometheus-susql.susql.svc.cluster.local:9090using the querysusql_total_energy_joules{susql_label_1=my-label-1,susql_label_2=my-label-2} - From
statusof theLabelGroupCRD given aslabelgroup.status.totalEnergy
