Plotly
Built on top of d3.js and stack.gl, Plotly.js is a high-level, declarative charting library. plotly.js ships with over 40 chart types, including 3D charts, statistical graphs, and SVG maps. plotly.js is free and open source and you can view the source, report issues or contribute on GitHub.
See here (https://plotly.com/javascript/) for more information about Plotly
- Render plots using the API
Plotly.newPlot(from within node.js) - Save to file without rendering, using the API
Plotly.toBase64 - Generate a base64 encoded string of the image, using the API
Plotly.toBase64
- You can try plotly from within a node.js environment and get the exact same output you'd get when using Plotly in a browser.
- Currently Plotly requires an internet connection to inject the plotly script into the output renderer.
- To render plots using plotly merely import
plotlyfromnode-kernelusing any of the following import styles:
const { Plotly } = require('node-kernel');
import { Plotly } from 'node-kernel';- installation of the package
node-kernelis only recommended if you need code completion for Plotly. - This package is build into the notebook kernel (hence does not need to be installed)
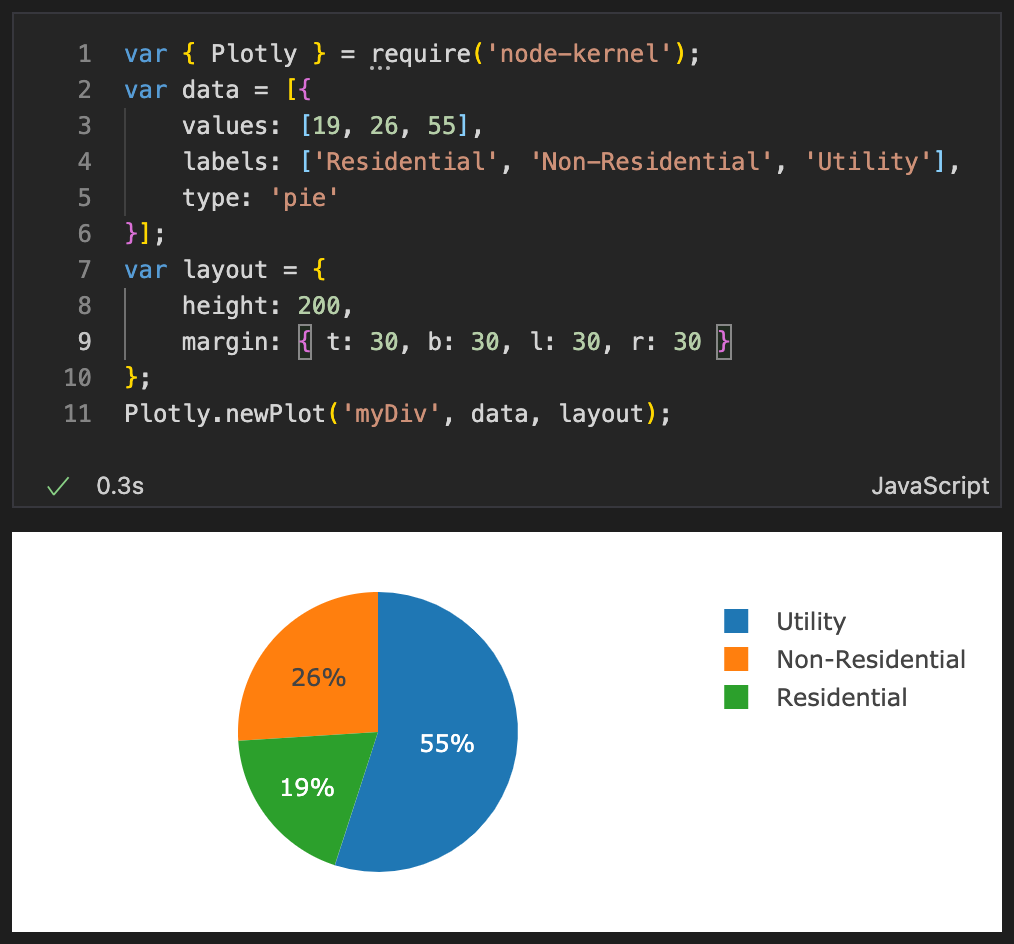
const { Plotly } = require('node-kernel');
var data = [{
    values: [19, 26, 55],
    labels: ['Residential', 'Non-Residential', 'Utility'],
    type: 'pie'
}];

var layout = {
    height: 400,
    width: 500
};

Plotly.newPlot('myDiv', data, layout);const { Plotly } = require('node-kernel');
var data = [{
values: [19, 26, 55],
labels: ['Residential', 'Non-Residential', 'Utility'],
type: 'pie'
}];
var layout = {
height: 400,
width: 500
};
const outputFileName = Plotly.toFile(data, layout);
console.log(outputFileName);const { Plotly } = require('node-kernel');
var data = [{
values: [19, 26, 55],
labels: ['Residential', 'Non-Residential', 'Utility'],
type: 'pie'
}];
var layout = {
height: 400,
width: 500
};
const outputBase64 = Plotly.toBase64(data, layout);
console.log(outputBase64);Note, the image will be displayed, but you can switch the mime type and view the base64 version as follows:

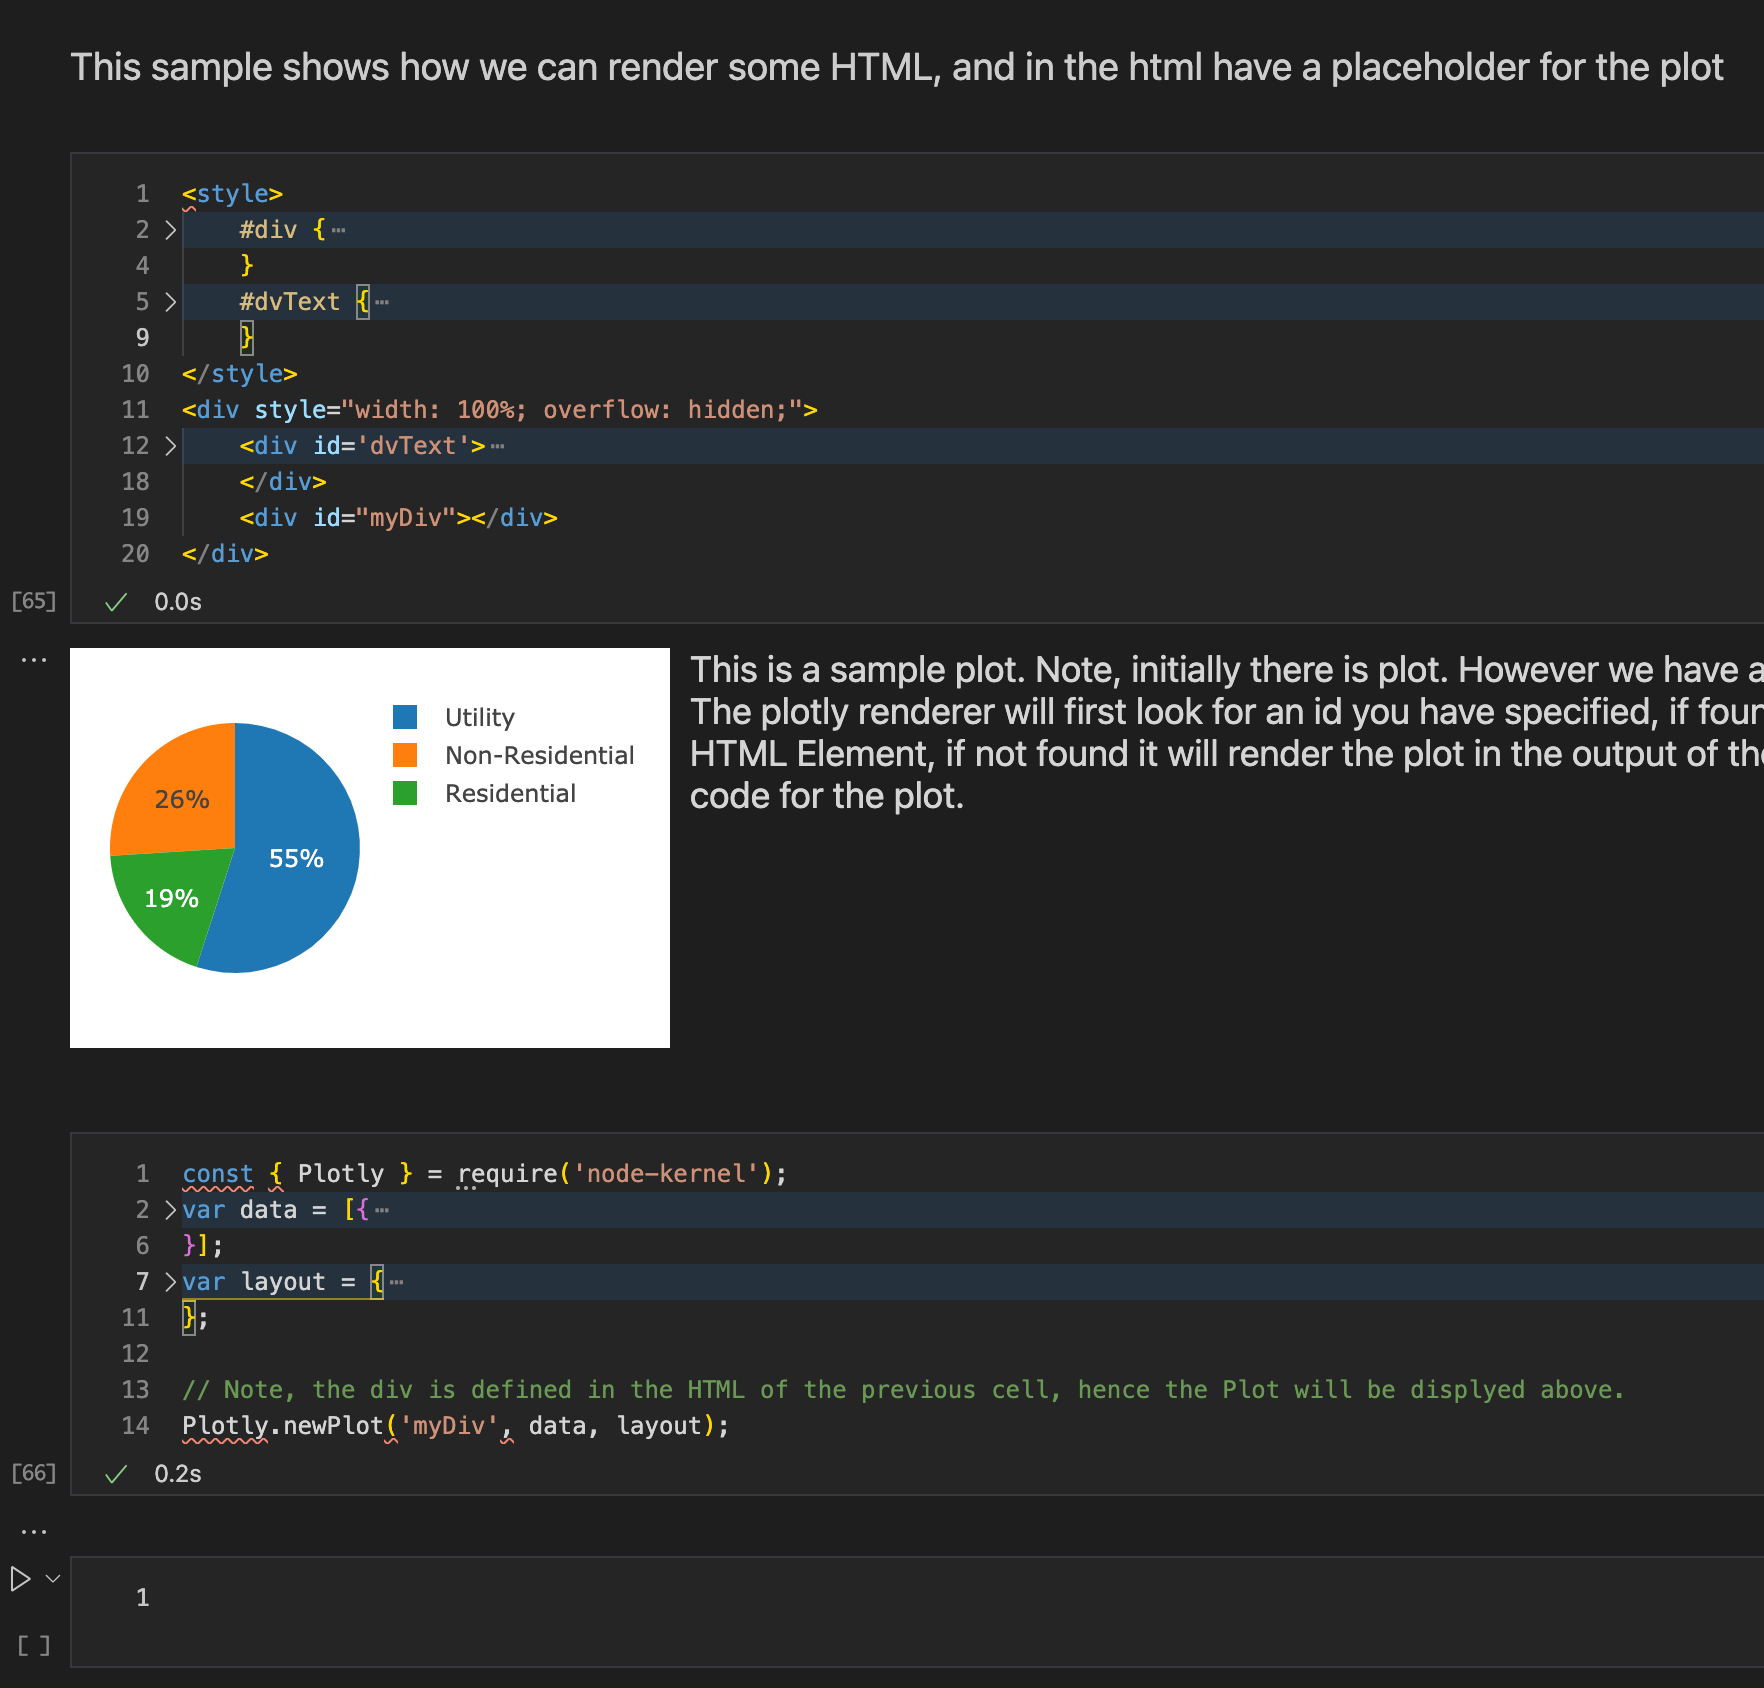
- Create an HTML cell with the following markup & run this.
<style>
    #div {
        width: 500px;
    }

    #dvText {
        margin-left: 510px;
        font-size: large;
        float: left;
    }
</style>
<div style="width: 100%; overflow: hidden;">
    <div id='dvText'>
        This is a sample plot. Note, initially there is plot.
        However we have an empty div with the id `myDiv`.
        The plotly renderer will first look for an id you have specified, if found it will render the plot in that HTML
        Element, if not found
        it will render the plot in the output of the same cell which contains the code for the plot.
    </div>
    <div id="myDiv"></div>
</div>- Next create a JavaScript cell with the followig code and run it
const { Plotly } = require('node-kernel');
var data = [{
    values: [19, 26, 55],
    labels: ['Residential', 'Non-Residential', 'Utility'],
    type: 'pie'
}];
var layout = {
    height: 400,
    width: 500
};

// Note, the div is defined in the HTML of the previous cell, hence the Plot will be displyed above.
Plotly.newPlot('myDiv', data, layout);- Note how the plot is injected into the HTMl generated by the first cell (because the element named
myDivexists in the output of the first cell).
/**
 * Renders a plotly plot.
 * See detailed documentation here https://plotly.com/javascript/plotlyjs-function-reference/#plotlynewplot
 */
export function newPlot(
    root: plotly.Root,
    data: plotly.Data[],
    layout?: Partial<plotly.Layout>,
    config?: Partial<plotly.Config>
): Promise<void>;
/**
 * Returns a base64 encoded string representation of the generated plot.
 * @param {plotly.Data[]} data See detailed documentation here https://plotly.com/javascript/plotlyjs-function-reference/#plotlynewplot
 * @param {plotly.Layout} layout See detailed documentation here https://plotly.com/javascript/plotlyjs-function-reference/#plotlynewplot
 * @param {('png' | 'svg' | 'jpeg')} [format] Defaults to 'png' if not specified.
 */
export function toBase64(
    data: plotly.Data[],
    layout: plotly.Layout,
    format?: 'png' | 'svg' | 'jpeg'
): Promise<string>;
/**
 * Saves the generated plot into a file.
 * Return the path to the file name (if a file path is not provided a temporary image file is created and returned).
 * @param {plotly.Data[]} data See detailed documentation here https://plotly.com/javascript/plotlyjs-function-reference/#plotlynewplot
 * @param {plotly.Layout} layout See detailed documentation here https://plotly.com/javascript/plotlyjs-function-reference/#plotlynewplot
 * @param {('png' | 'svg' | 'jpeg')} [format] Defaults to 'png' if not specified.
 * @param {string} [file] Destination file path for the image to be downloaded.
 * If not specified, the image is downloaded into a temporary file and that path is returned.
 * @return {*}  {Promise<string>}
 */
export function toFile(
    data: plotly.Data[],
    layout: plotly.Layout,
    format?: 'png' | 'svg' | 'jpeg',
    file?: string
): Promise<string>;