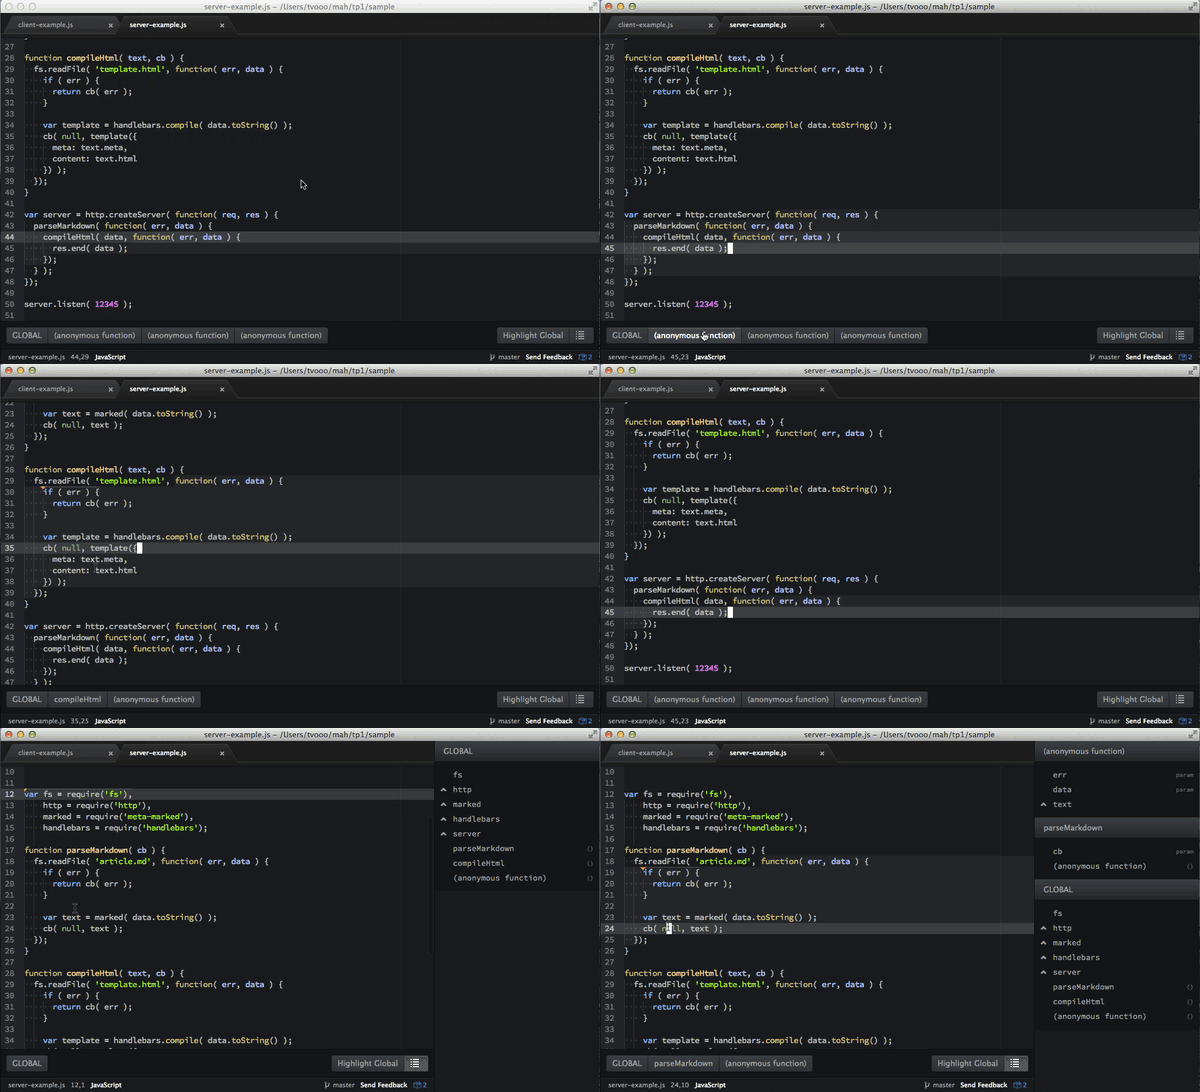
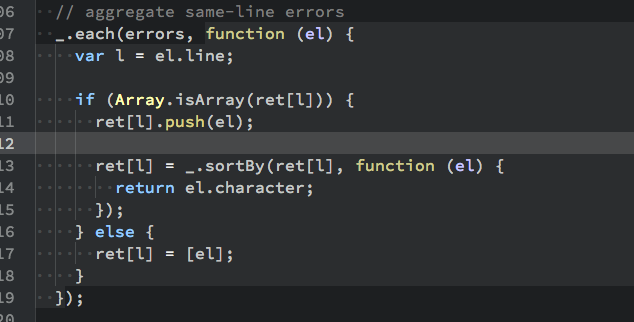
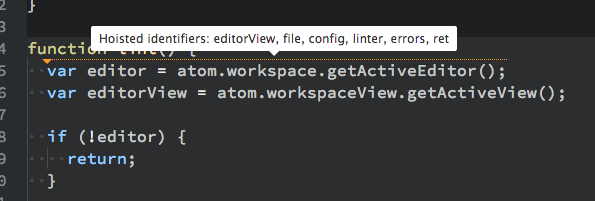
View your JavaScript code from a different perspective. Explore nested scopes and detect variable shadowing and hoisting.
Makes use of the new Decorations API. Please upgrade your Atom and make sure to enable the React editor view.
If you've installed after 20 July 2014, some metrics are tracked BY DEFAULT. If you want to disable this, see below.
I'm working on this as part of my Master's thesis project in Interaction Design.
Don't expect it to work perfectly, especially when it comes to parsing and analyzing the scope. This is a proof-of-concept. Please report any bugs and suggestions.
$ apm install scope-inspector
ctrl+alt+i toggles the sidebar
From 20 July 2014, this is enabled by default.
Scope Inspector is a project I'm doing for my thesis in Interaction Design. For my research, I would like to track some usage metrics. Please keep tracking enabled in the package's settings view, it will help my work a great deal.
Additionally, I am happy for any qualitative feedback I get. If you're willing to participate in an interview, please send me an email.
Here's what is going to be tracked:
- Your, userId which is a hash generated through your MAC address. Same as what Atom's Metrics package does.
- Plugin is enabled/disabled
- Sidebar is toggled
- Breadcrumbs are toggled
- Highlighting is toggled
- Hoisting Indication is toggled
- Breadcrumb is hovered (scope highlight)
- Breadcrumb is clicked (navigate to surrounding scope)
Open the Settings View, navigate to the "Scope Inspector" package and remove the checkmark before "Track Usage Metrics".
"Current scope" - the scope that your cursor is placed in :)
- Show scope nesting
- Navigate the scope-ladder upwards
- Highlight surrounding scopes
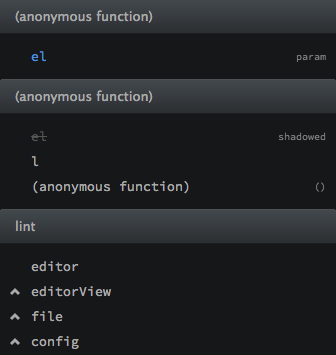
List parameters, variables and nested functions of the current and all surrounding scopes (closest is on top, furthest [global scope] on the bottom)


